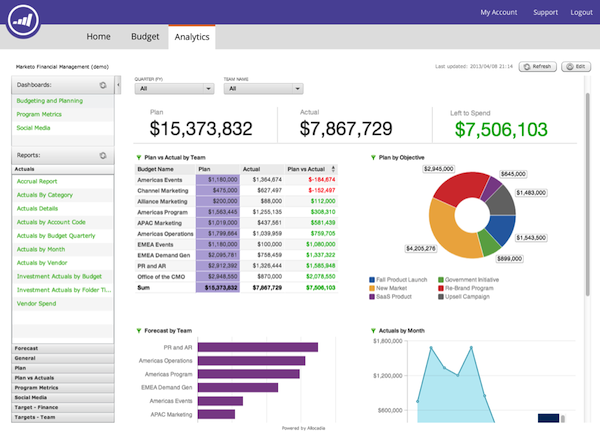
“Every single pixel should testify directly to content” –
Edward Tufte
I came across this great little video from Off Book series by PBS on the art of data visualization. The video includes interviews with data visualization specialists Edward Tufte, Julie Steele, Josh Smith, and Jer Thorp.
In the video, Edward Tufte states that the practice of data visualization is about learning to see data, rather than looking to confirm a pre-existing assumption. I thought this idea was particularly interesting as it implies that the viewer needs to approach data with an open mind. Data is merely a result of research, meaning it is just a clue to the end truth. When you translate data from complicated to simple, the goal of the viewer is ascertain new observations from the data.
3 components to inform your data visualization:
- You – knowing what you want to communicate
- The reader – the readers bias that we need to account for
- The data itself – understanding how that data informs the truth
My favorite quotes from the video:
“It’s eye-opening to think of data visualization as 6,000 years old, beginning with cartography”
“Style and aesthetics can not rescue failed content”
“The history of visualizing data is very substantially a history of science”


